Market Volatility
See how your reaction to market ups and downs can impact your long-term investment outcome.
See how your reaction to market ups and downs can impact your long-term investment outcome.
What do you do?
In the late 90s and early 2000s, consumer access to the World Wide Web increased significantly and investors flocked to internet-based companies hoping to capitalize on the trend. In the excitement, traditional company valuation metrics, such as the price-earnings ratio, became distorted as investors rushed to buy the next hottest dot-com stock. The result was a stock market bubble that burst in early 2000.
Your decision was made just prior to the bubble bursting. This point of the market cycle is characterized by euphoria, as persistently higher investor sentiment can cause many to overlook otherwise obvious financial risks.
Although the definitive cause of the 2008 financial crisis is the subject of some debate, a series of complex and interconnected events unfolded over the course of 2007-2008, resulting in the collapse of several companies. The events threatened the foundations of the global financial system and plunged the world into an economic downturn that’s now commonly referred to as the “Great Recession”. There was no shortage of gloomy headlines in 2008, as investors feared the worst and markets responded in real time to the news.
Your decision was made as the stock market approached a bottom during the financial crisis – a point of the market cycle that is often dominated by fear, but also a moment of significant opportunity.
Uncertainty was the dominant theme of 2016, as the United Kingdom held a referendum to exit the European Union (known as “Brexit”) and Donald Trump became president elect of the United States of America. Amidst this backdrop of political upheaval, investors were still digesting news that China’s economic growth had slowed to its lowest level in 25 years. The slowdown sparked fears of a global recession, wreaking havoc on equity markets as investors feared the end of a strong bull market. West Texas Intermediate crude oil also spiked in 2016 after hitting multi-year lows early in the year, adding another element of uncertainty that fueled market volatility.
Your decision was made in the midst of this uncertainty, in a year that reminded investors that volatility and investing in the stock market go hand-in-hand.
January 1st, 1970

Volatility and investing in the stock market go hand in hand, but keeping a long-term perspective and a level head is usually the best approach to reaching your goals.
Your reaction to market ups and downs can impact your long-term investment outcome.
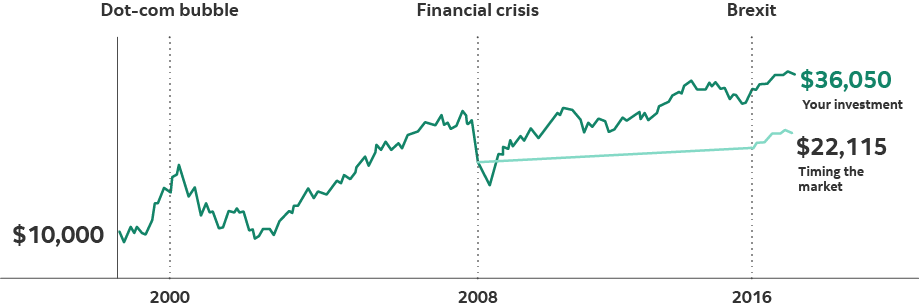
In this simulation, you opted to stay invested during the Dot-com bubble, stay invested during the Financial crisis and stay invested during Brexit. The value of your hypothetical portfolio was $44,297 compared to $27,174 for a hypothetical investor who tried to time the market over 20 years.
®Registered trademark of The Bank of Nova Scotia, used under licence. For illustrative purposes only. The illustration shows the hypothetical growth of $10,000 invested various ways between December 31, 1998 and December 31, 2021, using the S&P/TSX Composite TR Index to represent the stock market and a hypothetical 1.25% rate of return for cash. Comparison scenario assumes "stay invested" was chosen at each decision point. Assumes reinvestment of all income and no transaction costs or taxes. Indices are not managed and it is not possible to invest directly in an index. The illustration is hypothetical and does not reflect actual results or the future returns or future value of a mutual fund or any other investment. The information provided is not intended to be investment advice. Investors should consult their own professional advisor for specific investment advice tailored to their needs when planning to implement an investment and/or tax strategy to ensure that individual circumstances are considered properly and action is taken based on the latest available information.
Page 1 of 1